STRAIN GUAGE MEASURE, DATA ACQUISITION
This page contains a reprint of a paper we wrote describing our method of diagnosing conveyor problems on existing equipment using a combination of Digital Twins created in BeltStat, Data Collection, and Site Inspection.
INVESTIGATING MYSTERIOUS CONVEYOR FAILURES
Most conveyor failure investigations consist of: a visual inspection, a basic engineering design review, and a review of the historical trends stored in the site’s data historian. When shockwaves caused the event, this approach often fails uncover the root cause of the failure. The sensors necessary to detect shockwaves are rarely installed on conveyors, and when they are, the data historians employed in industry today almost never record these sensors’ output frequently enough to detect the shockwave.
Motors, brakes, and holdbacks can generate torque high enough to break couplings or reducers. Rapidly increasing or decreasing torques can also generate shockwaves in the belt that are strong enough to break: pulleys, structures, belt splices, or cause issues in vertical and horizontal curves.
When Conveyor Dynamics, Inc. (CDI) suspects a dynamic torque or shockwave event caused a conveyor to fail, we install a high-speed data acquisition system and temporary instrumentation that we developed to record rapidly changing torque in a conveyor's drivetrain. Our system allows us to determine how to modify a conveyors mechanical design and/or control system to eliminate damaging shockwaves and extend the life to many years, of equipment that used to fail in months.
Issues with Typical Conveyor Instrumentation
Motors, brakes, and holdbacks can all change the torque in the drivetrain in milliseconds. A motor in particular, can subject the drivetrain to 2 – 3 times its nameplate torque in a few milliseconds if the motor is not properly controlled. Most data historians deployed in the field, like the popular PI System from OSIsoft, record the PLC inputs every 2-5 seconds in a temporary buffer, and to save space after a few hours, the systems usually resample data, saving only one sample every few minutes in a persistent database. Even a 2 second sample rate is much too slow to detect rapidly changing drivetrain torque or shockwaves moving at the speed of sound. To get a clear picture of these dynamics, a sample time no slower than 10ms is required.
Very few conveyors have sensors installed to measure drive shaft torque. Motor current is commonly measured, but this parameter is tricky to convert to torque when the speed of conveyor is low or the system is lightly loaded. Motor current has no relation to brake and holdback torque which are also important sources of shockwaves. Brake torque can be inferred from brake pressure sensors (when they are present), but this requires assumptions about pad wear, brake fade, and minimum pressure to release the brakes that may or may not be true. In our experience, the best way to detect unanticipated torques in the drivetrain is to measure the shaft torque directly using strain gauges.
Detecting Conveyor Dynamics
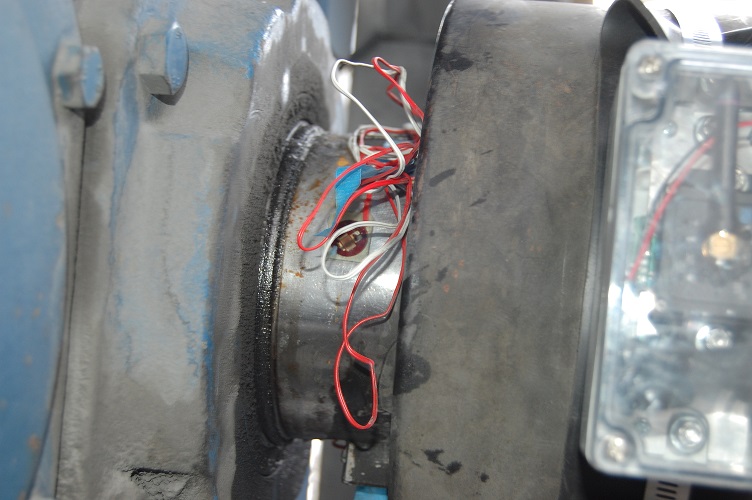
To measure shaft torque, CDI installs temporary strain gauges on the pulley shafts, and convert the strain measurements to shaft torque. Our strain gauges are driven by a strain gauge amplifier/transmitter mounted to the output shaft of the reducer (Figure 1) that transmits the strain and temperature to a receiver connected to a laptop computer.
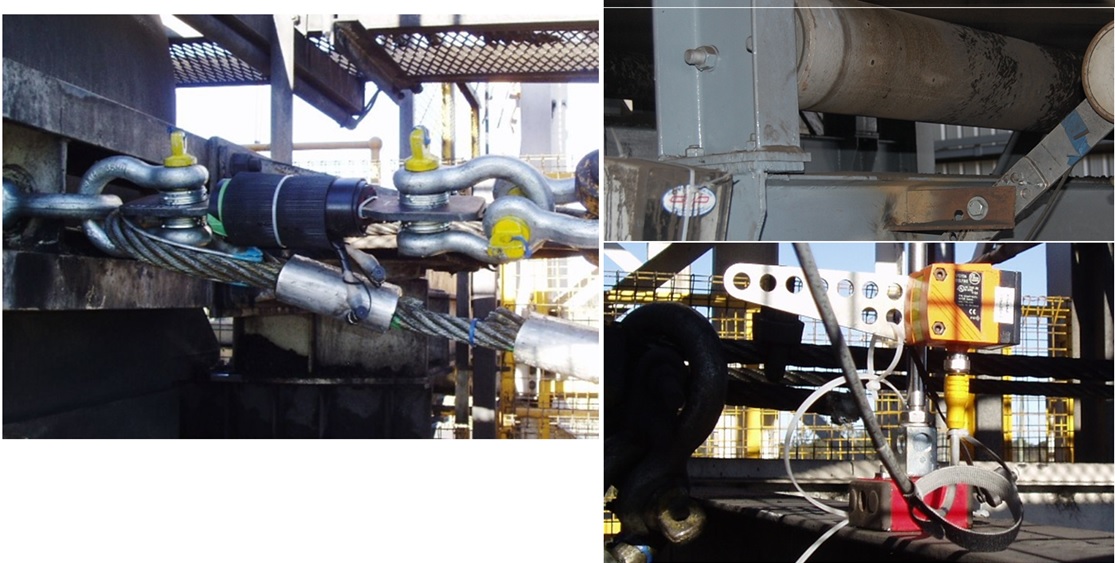
In addition to shaft torque, we sometimes need to record brake proximity switches, brake pressures, the conveyor start command, take-up winch tension, take-up position, belt speed, belt side travel, wound rotor motor resistor contactor proximity switches, or accelerometer output. Radio transmitters are not required to collect these additional signals and we typically hardwire our DAQ box to the instruments measuring these values, or to a PLC output cards. Many conveyors do not have the instrumentation needed to measure belt speed, side travel, take-up position, or take-up tension. When required, we install the temporary sensors shown in Figure 2 to obtain these measurements. CDI typically configures our DAQ boxes to sample at a rate of 64 Hz, but on occasion we have sampled a system at 1000 Hz.
Real World Results
General
To illustrate the kinds of problems our instrumentation can detect we have chosen four examples from the real world. It is very uncommon for us to find the same problem in two different conveyors. These examples show the wide range of unusual problems our instrumentation can detect.
Wound Rotor Motor Torque Spikes Failing Reducers
Wound rotor motors are a type of induction motor where the rotor windings are connected to external resistors via slip rings. Increasing the resistance, reduces the motor torque. To achieve a smooth start, each motor is connected to a binary stack of resistors connected in series. Each individual resistor in the stack is typically connected in parallel with a contactor. Closing several of the contactors shorts their resistors effectively removing them from the stack while allowing the unshorted resistors to reduce the motor torque. I typical stack with different 8 resistors can be combined in 28 = 256 different resistance levels.
The higher the motor rpm, the less resistance required to achieve a given torque. Figure 3shows recordings from our strain gauges during the conveyor start. At a given level of resistance the torque clearly drops as the motor accelerates until the next “step” down in resistance restores the torque. The speed of the torque drop increases as the motor nears synchronous speed. Figure 4 shows that several of the step downs in resistance are creating large spikes in torque.
In many of the resistance steps, some contactors open and others close. When closing contactors do so before opening contactors open the resistance momentarily drops causing the motor torque to spike up. The specification for the contactors installed at this site stated that they close in 40ms and open in 100ms. The original designers delayed the contact close command by 100ms relative to the contactor open command hoping to avoid momentary low resistances. Figure 4 show the moment the PLC transmitted contactor state change commands, the moment the contactor proxy switches detected state changes, and the motor torque our system recorded during this resistance step change. We used different data loggers to record motor torque and contactor states so the time synchronization between the torque and contactor plots is not exact. The data shows that after 10 years of use the contactors needed 250ms to open, but still closed in 40ms. CDI adjusted the resistor timing so that the contactor close signal was 500ms after the contactor open signal. This eliminated the torque spikes. No reducers have failed in the 8 years since we completed the change. Diagnosing this problem required high frequency sampling of the contactor proxy switches, and shaft torque measurement neither of which were available in the conveyor as originally installed.
Slow Brakes
Figure 5 shows an intended motor stop on a large downhill conveyor. At about 25% speed the motors tripped, and the control system requested a brake stop. The strain gauges proved that for 15 seconds, Brake C did not apply, Brake B was at 39% motor torque, and Brake A was 82% motor torque. After 15 seconds, the control system realized that the conveyor was accelerating and requested a brake dump, rapidly applying the full brake torque on all three brakes (150%-200% motor torque). This data proved that the brake logic and/or hydraulics were unacceptable and needed to be replaced.
While it is true that brake pressure can be track in the PLC, the link between changes in brake pressure are torque is not linear, and the reduction in pressure while the brake calipers close the air gap between the brake pad and the drake disk results in no increase in torque. The exact pressure required for the pads to touch the disk without applying torque, depends on the pad wear and spring extension and is different for each brake. For this reason, brake pressure signals tend to indicate that the brakes applied faster than they really applied. Only strain gauges can measure the actual torque brakes apply and when they apply it.
Take-up Hysteresis
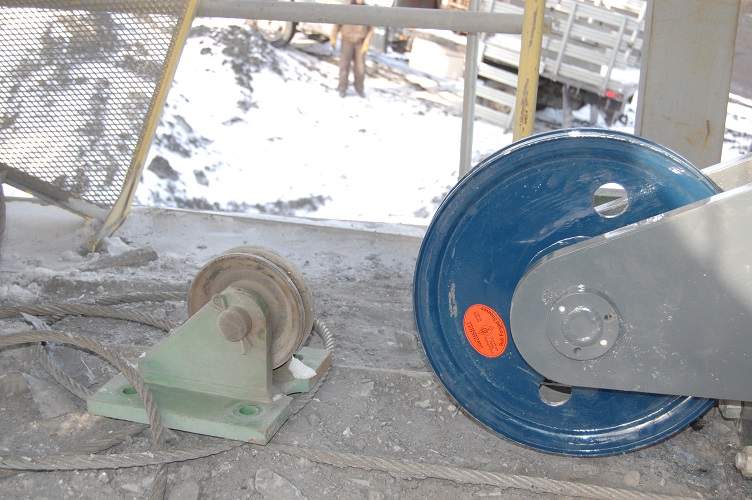
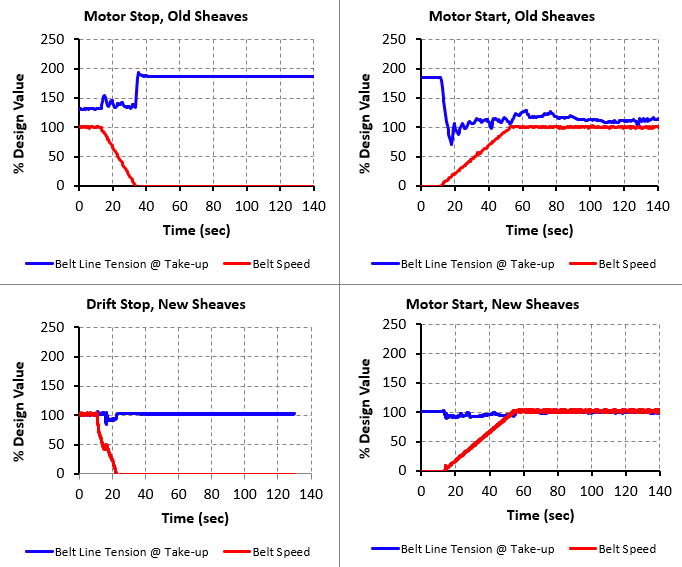
During one of our site inspections we noticed that the take-up sheaves guiding the take-up cable from a horizontal take-up to a gravity counterweight tower were too small. Replacing these sheaves with the required sheave size (Figure 6) was a costly change. CDI inserted a load cell between the take-up trolley and the cable and demonstrated that increasing the existing sheaves prevented the take-up counterweight from rising after the conveyor stopped which dramatically increased the tension in the belt. Increasing the sheave diameter freed the counterweight and allowed it to maintain constant belt tension at the take-up (Figure 7).
Conclusions
Strain gauges, load cells, and a high frequency data acquisition equipment reveal many issues in conveyors that are not apparent in data typically stored in a SCADA historian. They reveal the idiosyncratic behavior in each manufacturer’s product, provide better insight into how to tune, control, and model conveyor components. CDI's data acquisition system allows us to demonstrate why a particular conveyor component repeatedly fails when all the parties involved in the design say the design is correct.
If your conveyor failed for an unknown reason, or is simply unreliable, contact the engineers at Conveyor Dynamics, Inc.